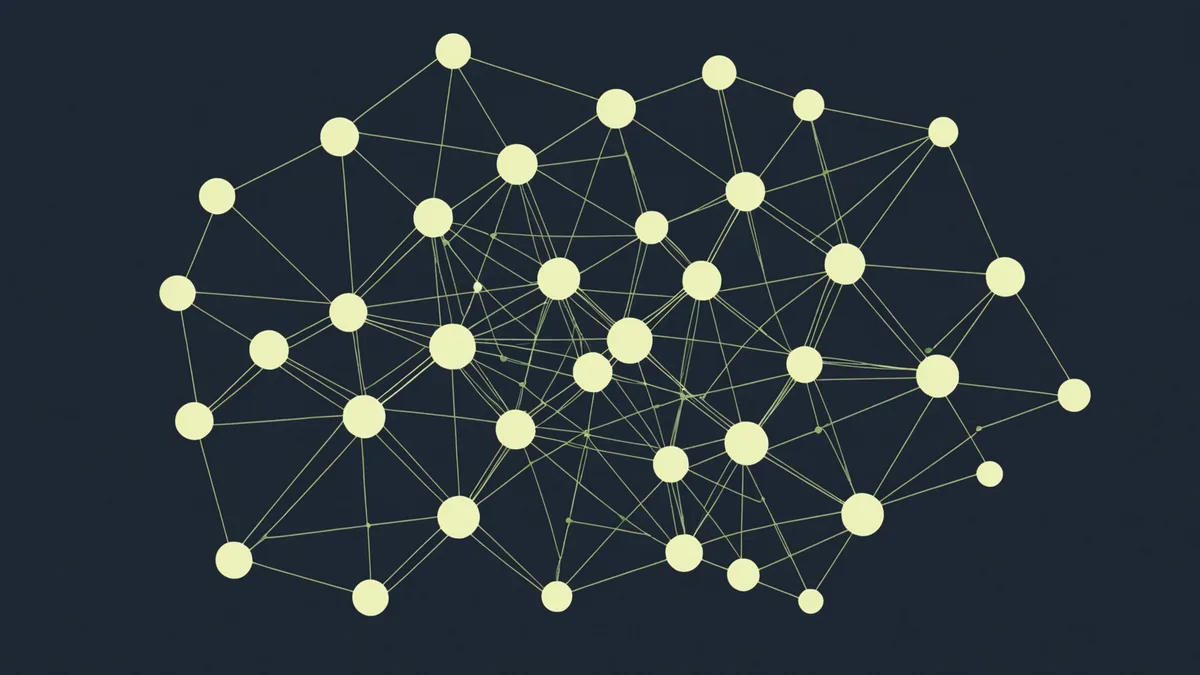
A knowledge graph for a private sector represents the companies in that sector as nodes, their properties as attributes, and their relationships to each other as typed edges. The challenge is building one from sources that were not designed to produce it.
Public filing data, job advertisement feeds, and government contract registries are not relational databases with clean entity keys. They are administrative records produced by different organisations for different purposes, using inconsistent naming conventions, variable data quality, and no shared identity scheme for the companies they describe. Getting from that collection of inputs to a usable graph requires three layers of work: entity identification, relationship extraction, and resolution. This note describes how we approach each.
Entity identification: the company as a stable node
A company in the UK has a unique Companies House registration number. That number is stable, regardless of how many times the company changes its name, registered address, or stated SIC code. In theory, this gives us a reliable primary key for every UK-registered entity in the graph.
In practice, the Companies House number is not consistently present in the other data sources we need to integrate. Job advertisements rarely reference a company's registration number. Government contract award notices use free-text company name fields that reflect whatever the contracting authority chose to enter at the time. The same company might appear as "Orbis Process Solutions Ltd," "Orbis Process Solutions," "Orbis Solutions," and "OPS Limited" across different contract notices over a five-year period. None of those strings automatically resolves to the registration number.
This means entity identification has two distinct components: first, resolving all the name strings that refer to the same company to a single canonical identifier, and second, deciding which Companies House entities are in scope for the sector graph we are building. Both require methods that go beyond exact string matching.
Name resolution at scale
We use a multi-step resolution pipeline. The first pass is deterministic: exact matches on registered name, address normalisation to a postcode-level key, and phone number matching where available. This resolves the majority of cases where a company is referenced consistently across sources.
The second pass handles name variation: a combination of phonetic normalisation, token reordering (since "Orbis Process Solutions" and "Process Solutions Orbis" refer to the same entity), and blocking on industry category to limit the comparison space. Comparing every pair of strings in a large dataset is computationally impractical; grouping candidates by sector before comparison reduces the problem to a manageable size without materially increasing false negative rates.
The third pass handles entity ambiguity: cases where two similarly named companies are genuinely different entities. "Johnson Controls UK" and "Johnson Controls UK Services" might be two different Companies House entities with different registration numbers and different activities. Name similarity alone cannot resolve this; we need to check registration numbers, operating addresses, and SIC codes before deciding whether to merge or keep them as distinct nodes in the graph.
Relationship types in a sector graph
The value of a graph over a flat list of companies is the ability to traverse relationships. For a sector intelligence application, the relevant relationship types are different from those in a general business knowledge graph. We use four primary relationship types.
Group ownership
Parent-subsidiary relationships establish the corporate structure of the sector. Many mid-market companies operate through group structures: a holding company, an operating subsidiary, and possibly one or more dormant entities. The filing record makes these relationships partially visible through PSC entries and group accounts filings. Knowing that "Orbis Holdings Ltd" is the parent of "Orbis Process Solutions Ltd" and "Orbis Site Services Ltd" allows us to aggregate signals across the group rather than treating each entity as an independent company.
Commercial relationships inferred from contract data
Government contract awards record buyer-supplier pairs. When a company repeatedly appears as a supplier across multiple contract notices, it is telling us something about its customer type, contract scale, and sector focus. When two companies in the same sector both appear as suppliers to the same major buyer over multiple periods, that is a signal of competitive proximity. We represent these as typed edges in the graph, weighted by contract value and recency.
Director co-occurrence
When the same individual appears as a director across multiple companies in a sector, it may indicate a holding structure, a portfolio of related businesses, or an advisory role. Director co-occurrence edges flag these connections for investigation. They are not strong signals on their own, but they are useful for detecting group structures that are not fully disclosed in PSC filings, particularly where overseas holding entities are involved.
Address proximity
Companies sharing a registered address are often part of the same group or are served by the same formation agent. Address edges are weak signals compared to the others but useful for detecting nominee structures and for flagging cases where an apparently independent company may be a shell for a larger entity.
The resolution layer: handling inconsistencies across sources
Even after entity identification and relationship extraction, the graph contains inconsistencies. The same entity may have different attributes in different source records: the Companies House record may show the company as active while the job advertisement feed has returned no results for three years, suggesting that the company has stopped trading without formally dissolving. The contract data may show revenue activity that implies a larger company than the headcount in the filing record suggests, which might indicate outsourced delivery rather than direct employment.
We handle these inconsistencies through a confidence scoring approach rather than attempting to resolve every case to a single ground truth. Each attribute in the graph carries a source provenance and a derived confidence weight. When a downstream process queries the graph for the revenue band of a company, it receives the band alongside the confidence level. Low-confidence entries are flagged for review rather than silently accepted as ground truth.
This matters because the outputs of the graph are used by human analysts who are making decisions about whether to call a company. A confident incorrect band is worse than an acknowledged uncertain band, because the analyst calibrates their follow-up question accordingly. If the graph tells them the company is probably in the 5 to 10 million GBP revenue range with moderate confidence, they will ask about revenue early in a discovery conversation. If it tells them with high confidence that the company is in the 20 to 40 million GBP range and it is wrong, they may frame the conversation incorrectly and get the relationship off on the wrong foot.
What the graph does not contain
A note on scope: the graph we are building is a sector structure graph, not a general company knowledge graph. We are not trying to represent every company in the UK economy. We are trying to represent, accurately, the companies that compete in a particular sector and the relationships between them that are relevant for assessing acquisition potential.
That scope constraint is what makes the graph useful. A general-purpose company graph optimises for coverage; a sector graph optimises for accuracy within a defined domain. The two are not the same product and should not be evaluated the same way. The question we ask about any new data source or relationship type is not "does this add coverage?" but "does this improve the accuracy of the sector picture?" If the answer is no, we do not include it, even if it would be easy to add.